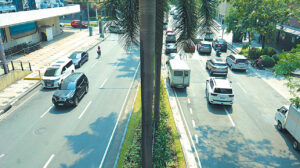
HEAVY TRAFFIC in Metro Manila is always news. It never grows tired, no matter that it has been a bane of metro living for decades. This is especially true during this time of the year when — like a trifecta — school, work, and the yearend holidays simultaneously appear to brew a perfect storm. Depending on the day of the week, the time of day, and the season of the year, road congestion arguably goes from bad to worse.
Many have cited the growing mobility needs of the country, the lack of roads, the inadequacy of public transport or a lack of enforcement of traffic rules as reasons for the mayhem. As it turns out, we — the drivers or passengers — are as much at fault. Our driving habits and the way we navigate the thoroughfares of the metro have as much an impact on traffic as the usual culprits we blame. To paraphrase the adage, it is not the car you got but how you use it that matters. Cars do not cause traffic; motorists do.
The dire situation of road congestion will not be denied. The TomTom Traffic Index ranked Metro Manila as the most congested metropolitan area in the world. Average travel time per 10 kilometers across the road network of Metro Manila was reported at 25 minutes and 30 seconds, up by 50 seconds from 2022. During rush hour, the average travel speed was recorded at 19kph.
In 2021, as mobility restrictions from COVID-19 were being lifted, a total of 3.2 million vehicles were reported to be plying the roadways of Metro Manila at an average speed of 30.63kph. In 2023, as businesses and government ramped up the return to office and schools resumed face-to-face classes, the number of vehicles on the roads increased to 3.6 million, moving at an average of 24.5kph.
Though work-from-home arrangements still linger, the resumption of face-to-face life continues to drive vehicles back to the roads. Mobility is, after all, an essential conveyor of economic and social activity. While usage of existing vehicles revert to or exceed pre-COVID-19 levels, traffic congestion is further aggravated by a resurgence in new vehicle sales. The local automotive market peaked at 473,000 units in 2017. It dropped by half to 244,000 in 2020 then trended back up to 438,000 last year. In 2024, sales are expected to reach a new record of close to 480,000. That is almost half-a-million new cars on the road, 40% of which are bought — and used — in Metro Manila. The good news is the government is hard at work building new roads, expressways, peripheral highways, and bridges.
SAFETY FIRSTRoad crash incidents — excluding the rising wave of road rage events — are also seen to be rising. From 2016 to 2019, the number of vehicle crashes averaged 114,506 per year, increasing by about 10% per year. This dropped by 61% to 65,032 incidences in 2020 but the 10% spike was again observed in 2021 and 2022. A study by the Metropolitan Manila Development Authority (MMDA) showed this to be a critical occurrence for traffic, since a 30-minute standstill resulting from a road crash incident creates a backlog spanning 2.5 kilometers and requiring 42 minutes to clear.
We’ve all had our fair share of experiences where a fender bender or a vehicle breakdown was enough to result in anarchy on the roads — not only because a lane is taken out of service but also because motorists cannot wait patiently in their lane, resort to creating their own lanes or, worse, make illegal counterflows. Surely, defensive driving and a regular dose of vehicle periodic maintenance service can go a long way in reducing congestion caused by accidents.
According to the MMDA, one cause of delay in the clearing of road accidents is the fact that their deputies need to wait for the police to appear on the scene to issue an accident report. This is apparently required by insurance companies in case of claims. The good news is that the Insurance Commission is now working to allow acceptance of MMDA reports to support insurance claims.
FLYOVERS VS. SERVICE ROADSAnother contributor to traffic is a penchant of motorists to use flyovers and underpasses versus the service roads. Motorists flock to the Shaw underpass on EDSA — cutting from the three right lanes into the two lanes of the underpass even if the service road is open. The MMDA reports that during morning peak hours, there are 49% more vehicles (11,067 vehicles) using the Santolan flyover than the service road (6,681 vehicles). In the afternoon, it is 97% more with 11,600 using the flyover and only 4,030 the service road. I think this is a carryover from before the introduction of the bus carousel lanes. When buses were confined to the rightmost lanes, it was traumatic to use the service roads because of “bus-bullying.” I have taken to using the service roads of EDSA as much as I can.
The MMDA believes that the suspension of the no-contact apprehension policy (NCAP) has also resulted in reduced road discipline and, consequently, increased roadside apprehensions that contribute to traffic. In 2022, a total of 97,000 traffic violations were registered. In 2023, after the implementation of NCAP was suspended by a temporary restraining order from the Supreme Court in August 2022, that number increased to 242,000. Arguably, ill-disciplined motorists have been emboldened due to the shutting of the “big eye in the sky.” Arguably.
Indeed, there are many contributors to our traffic woes. From two-wheelers occupying covered road lanes when it rains, to vendors making use of streets and pavements for business, to pedestrian jaywalking and illegal parking on roadsides. If we all try to get together on the right side of responsible driving and car ownership, though, I think we can help reduce this traffic nightmare that we are as much responsible for as we are victims of.
